repeated_failed_buildHIGH
Wrapped with `tma1 build -- npm test`. Agent retried three times, same error each time.
Stop retrying `npm test` and address this error first: TypeError: Cannot read prop ‘user’ of undefined
TMA1
TMA1 records every LLM call locally, then routes what it sees back into the agent’s next turn — hooks, MCP tools, anomaly detection, and a searchable history of every session on the machine.
My agent kept editing files I’d just changed by hand. I wanted it to notice._
AGENT ONBOARDING
Read https://tma1.ai/SKILL.md and follow the instructions to install or upgrade TMA1 for your AI agent
When the same Edit fails three times or a build keeps breaking, TMA1 injects the specific fix path into the next prompt — not into a postmortem next week.
Claude Code can pull Codex’s review on the same file, verbatim, via /tma1-peer. No copy-paste between terminal tabs.
/tma1-search retry backoff finds the session where you solved it before — yours or another agent’s — and reads back the conversation.
One Go binary. No Docker, no cloud. Data stays in ~/.tma1/.
Features
Closed-loop perception and cross-agent collaboration come first. The dashboards back them up. One Go binary, one local time-series store, no Grafana, no YAML.
TMA1 watches for repeated failures, stale views, broken builds. When a rule fires, it writes a concrete fix path into the agent’s next prompt — not into a dashboard for someone to read tomorrow. Five hooks deliver it. Six rules, each with an actionable suggestion. HIGH severity can block Stop so a broken build doesn’t silently ship.
When TMA1 sees something the agent should act on, it writes a concrete suggestion into the next prompt. These are real strings from the detector — what the agent literally reads:
Wrapped with `tma1 build -- npm test`. Agent retried three times, same error each time.
Stop retrying `npm test` and address this error first: TypeError: Cannot read prop ‘user’ of undefined
The file changed outside observed agent writes before the agent edited it.
Re-read auth.go before the next edit — your in-memory copy is older than what’s on disk.
Claude Code reads what Codex left on the same file, verbatim. Codex reads what Claude did. The /tma1-peer skill pulls the peer’s last session on this project — messages, tools used, files touched. By default an agent doesn’t see its own sessions in the peer list, so no echo chambers; ask for self and it reads its own history back.
Claude Code reads what Codex left, verbatim, through the /tma1-peer skill. The Codex-side skill does the reverse.
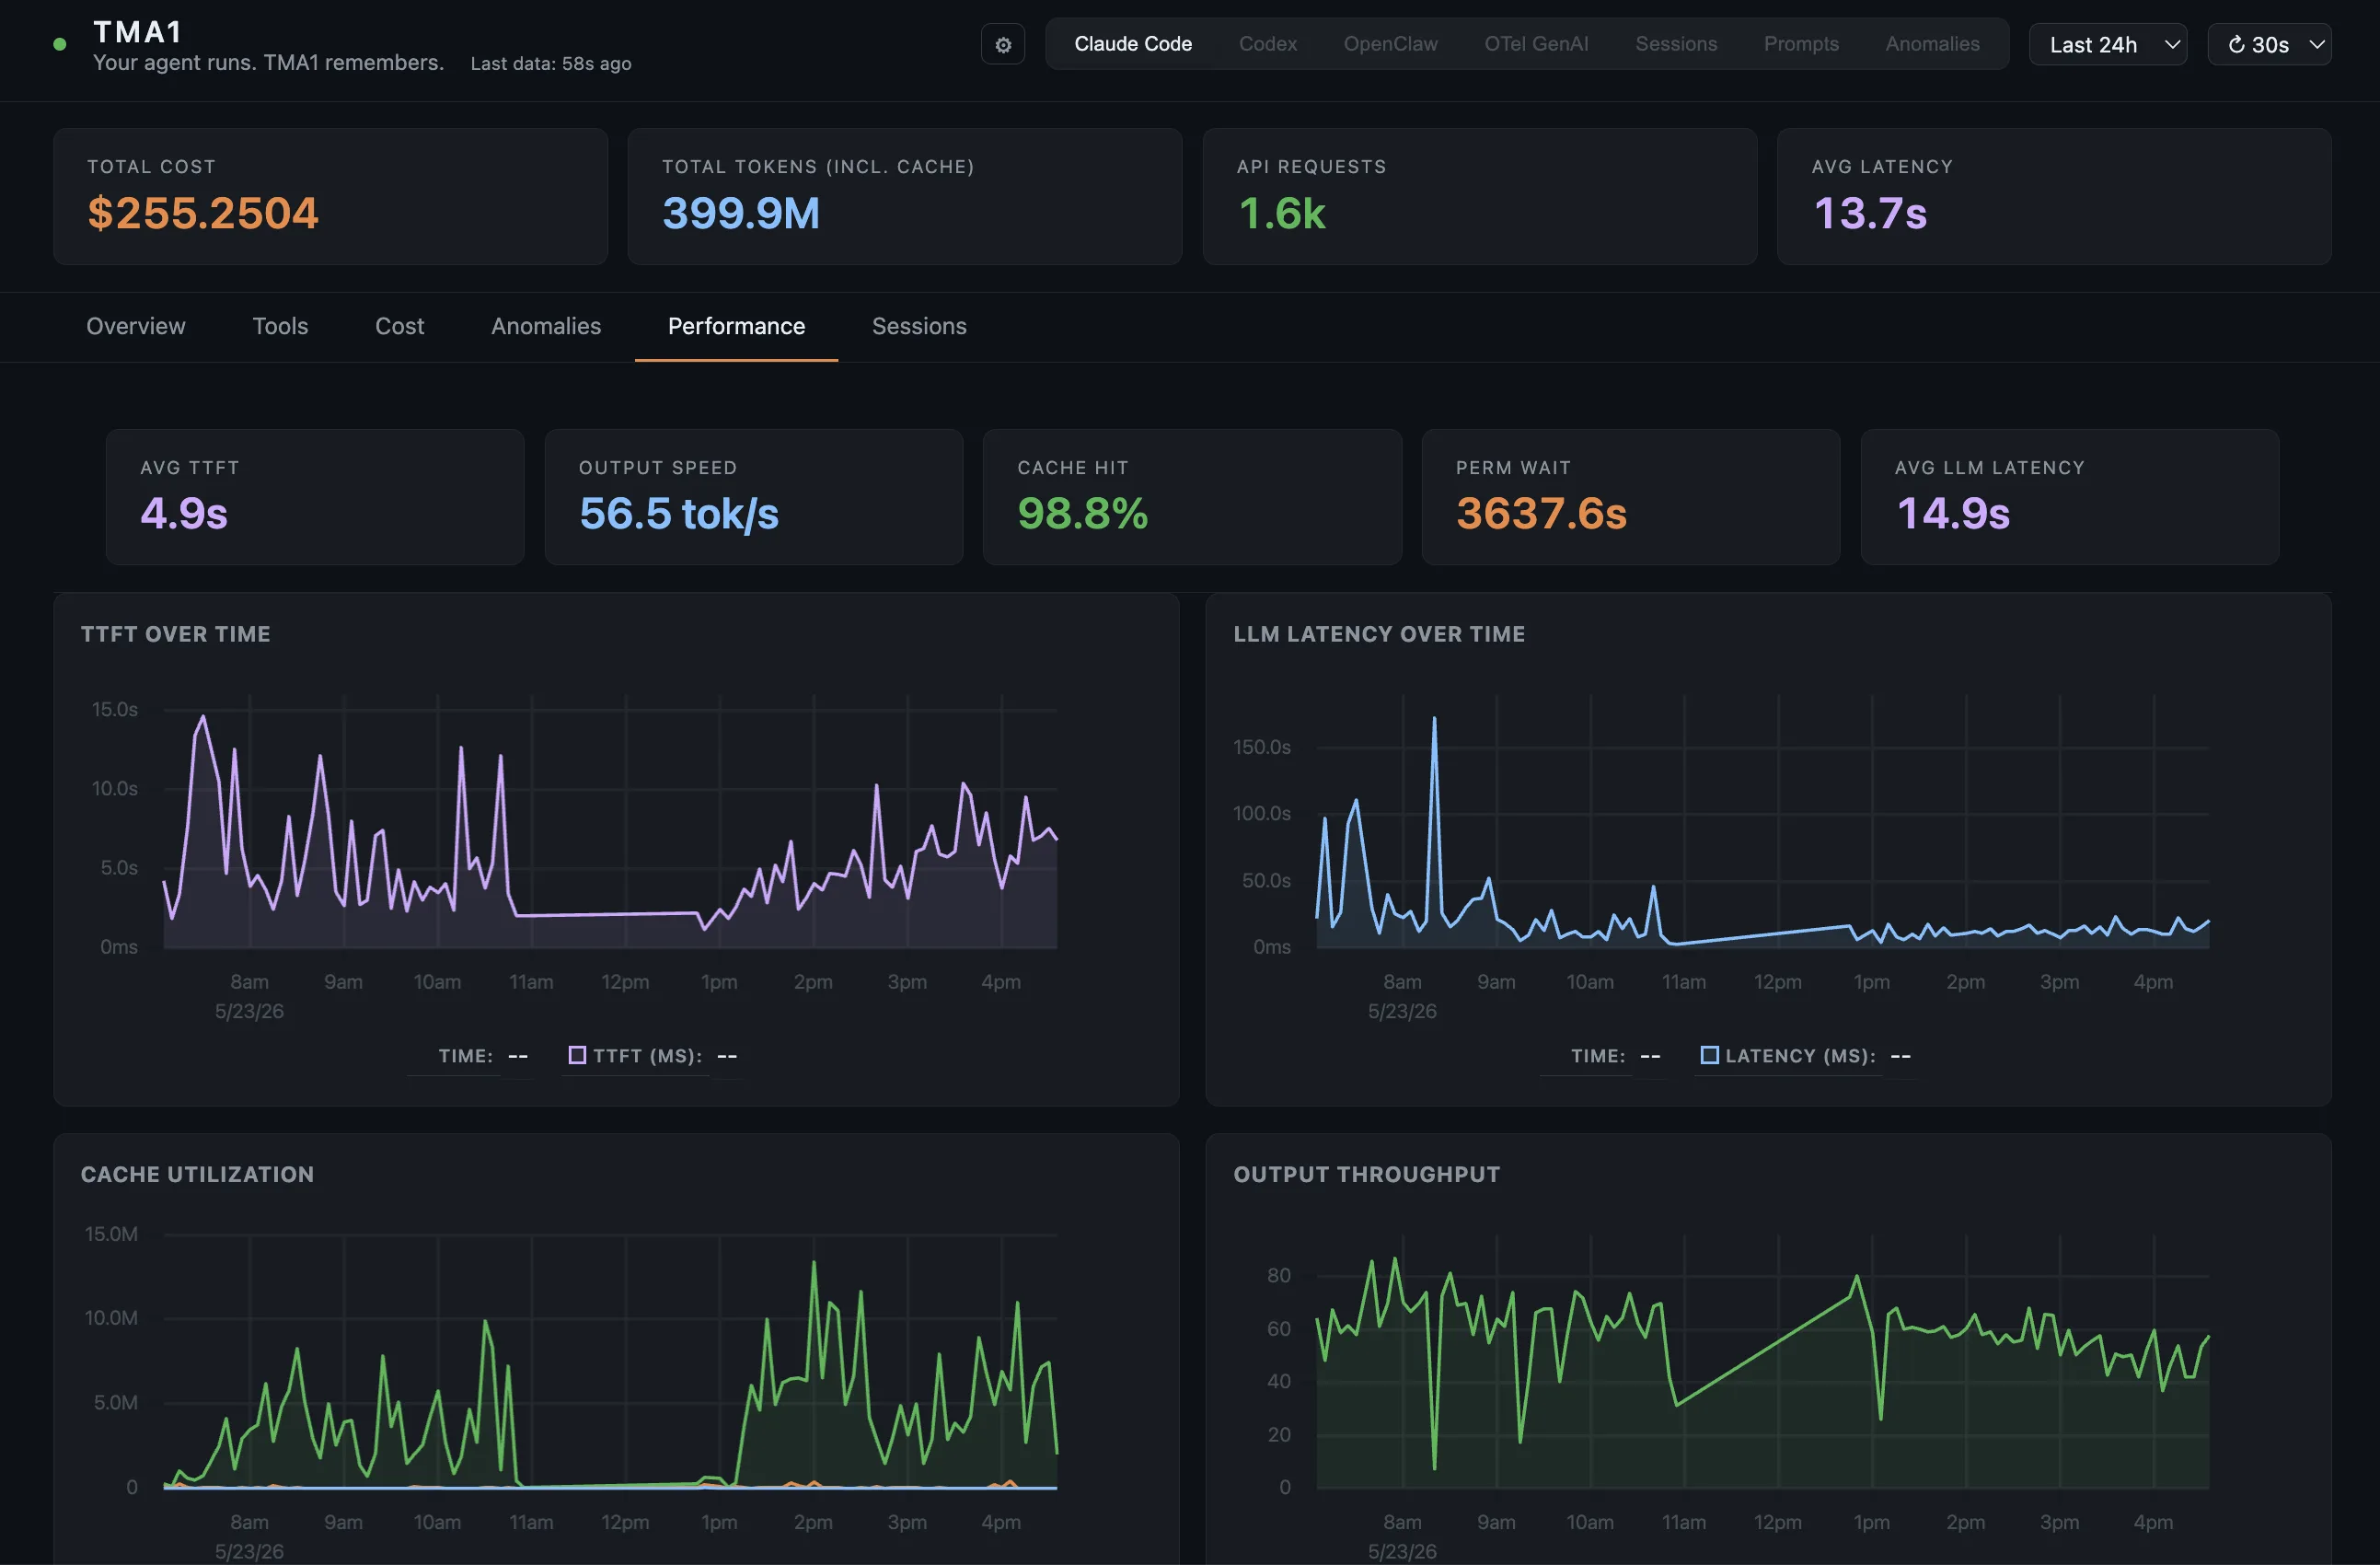
An agent stuck in a retry loop can burn hundreds of dollars. Each agent view has an Anomalies tab. Click any flagged request to jump straight into the session and see what went wrong.
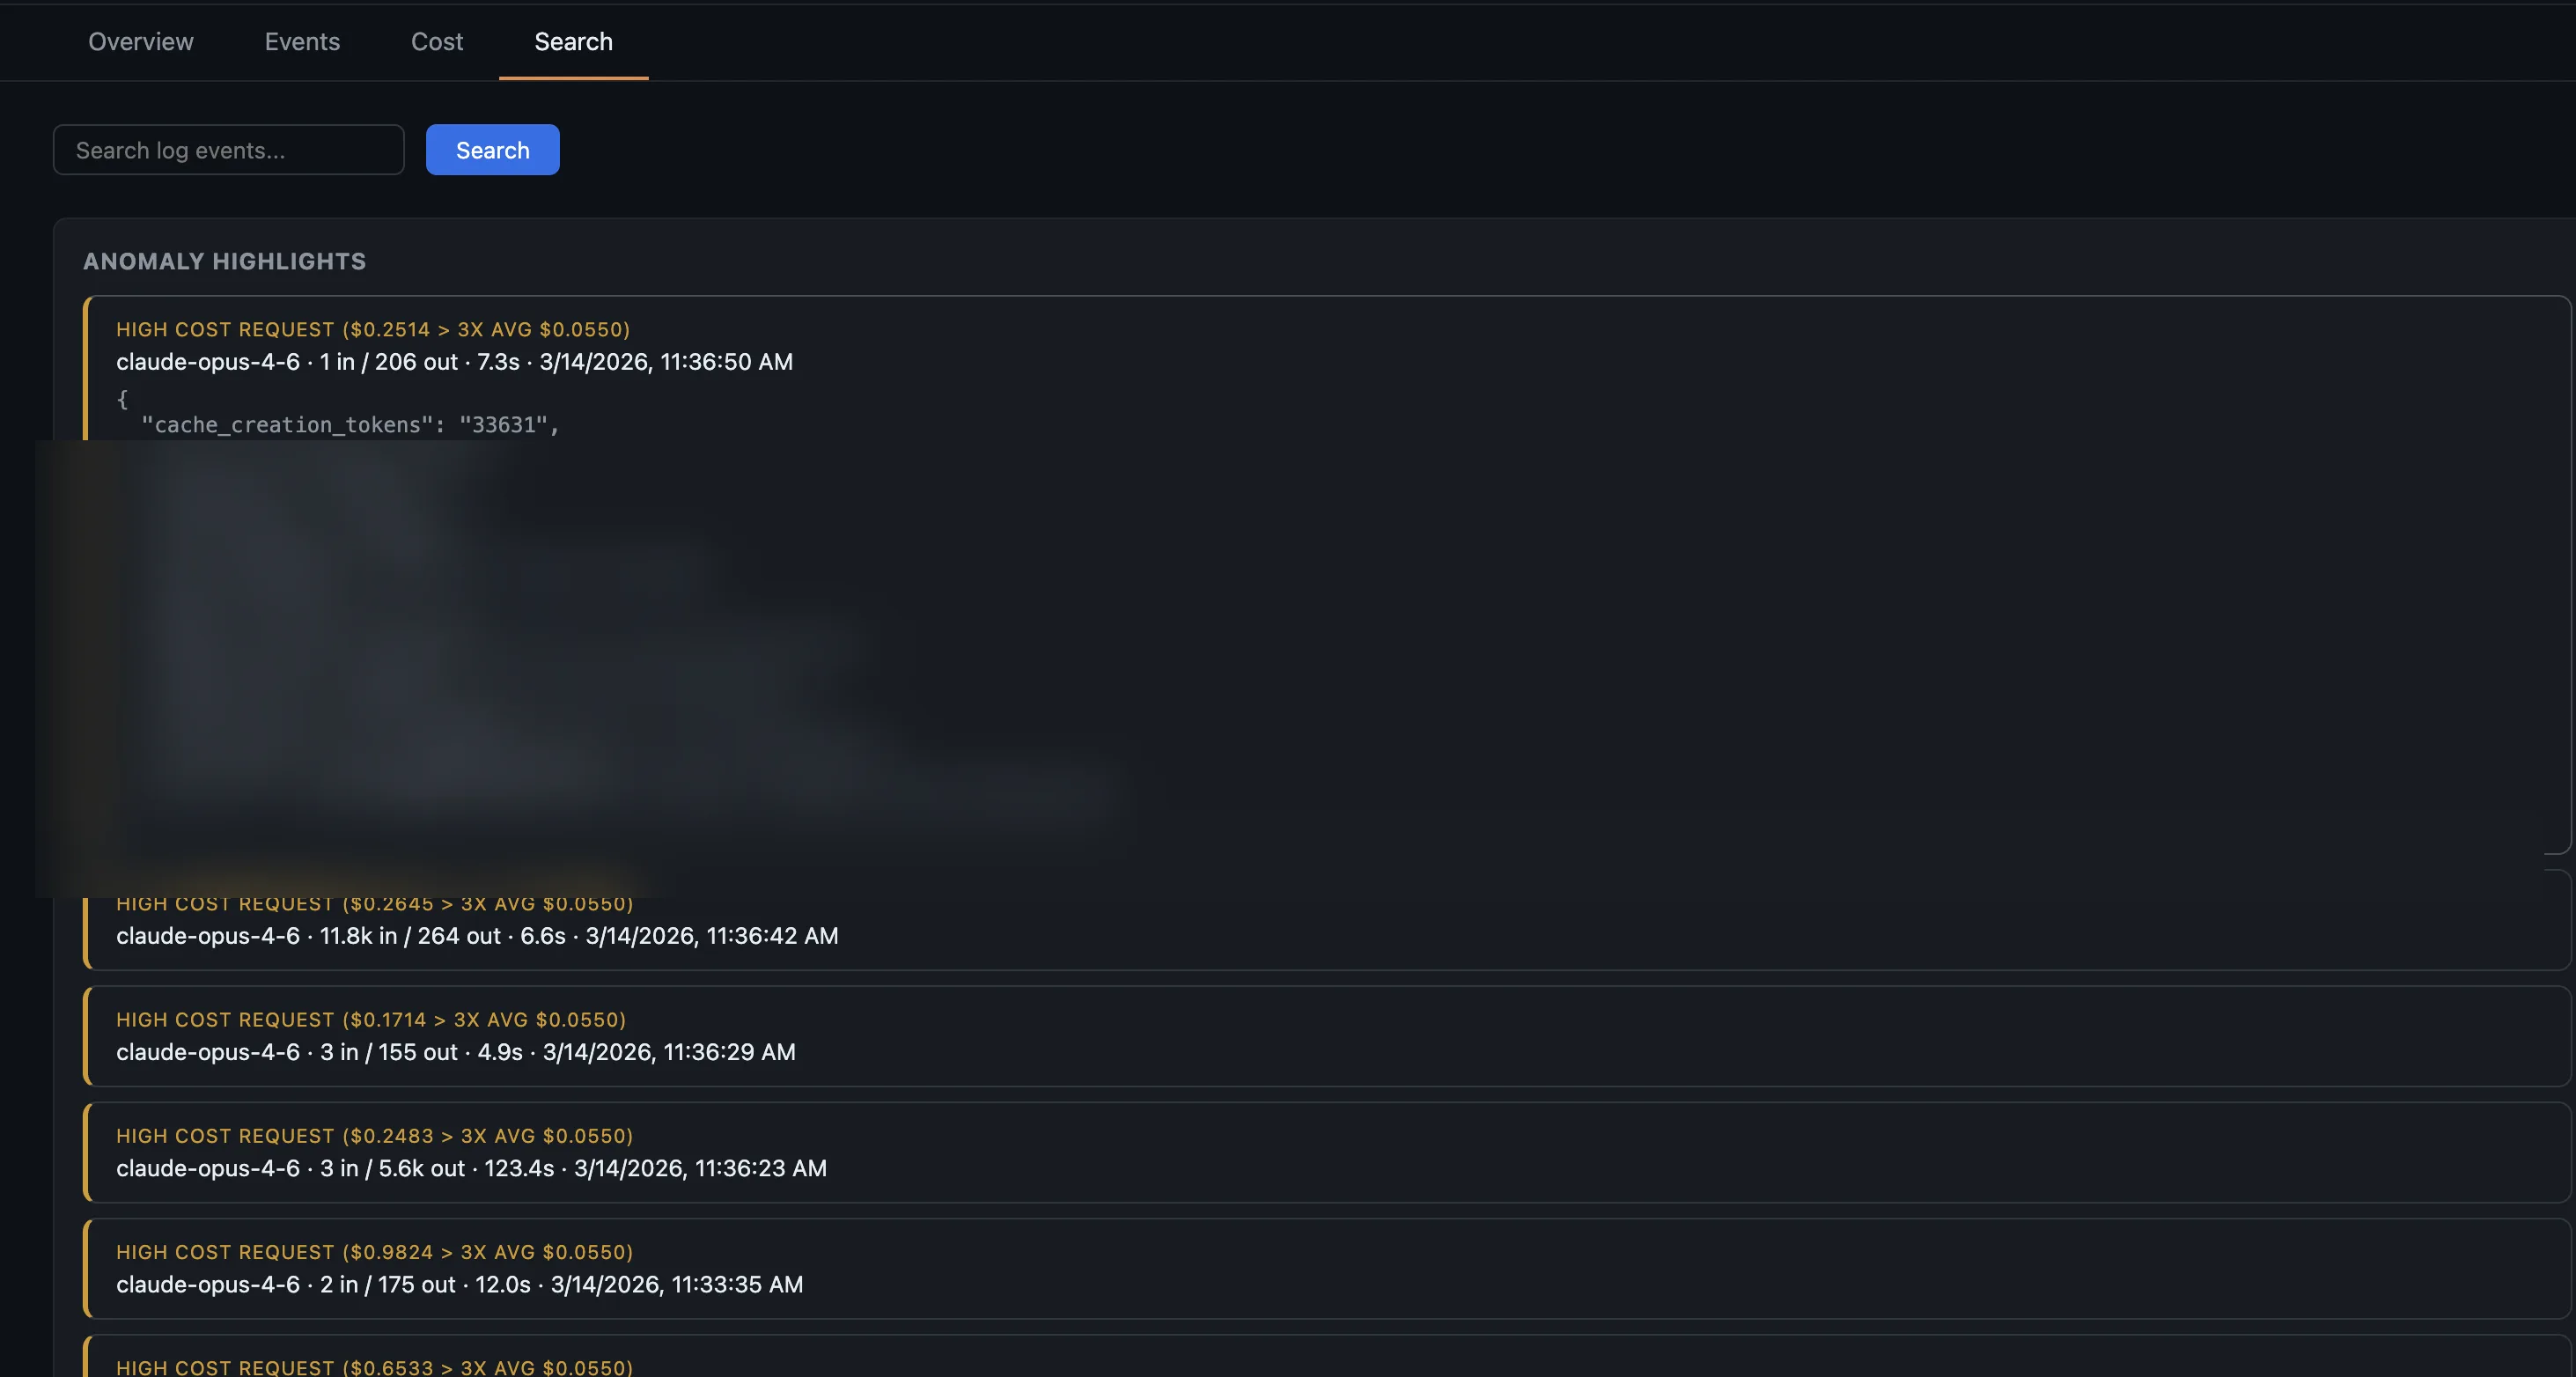
Your agent ran for 25 minutes across 4 turns. What happened? Open the session overlay: left side shows file activity, context breakdown, and API calls. Right side is the full event timeline. Or watch the live canvas while your agent works.
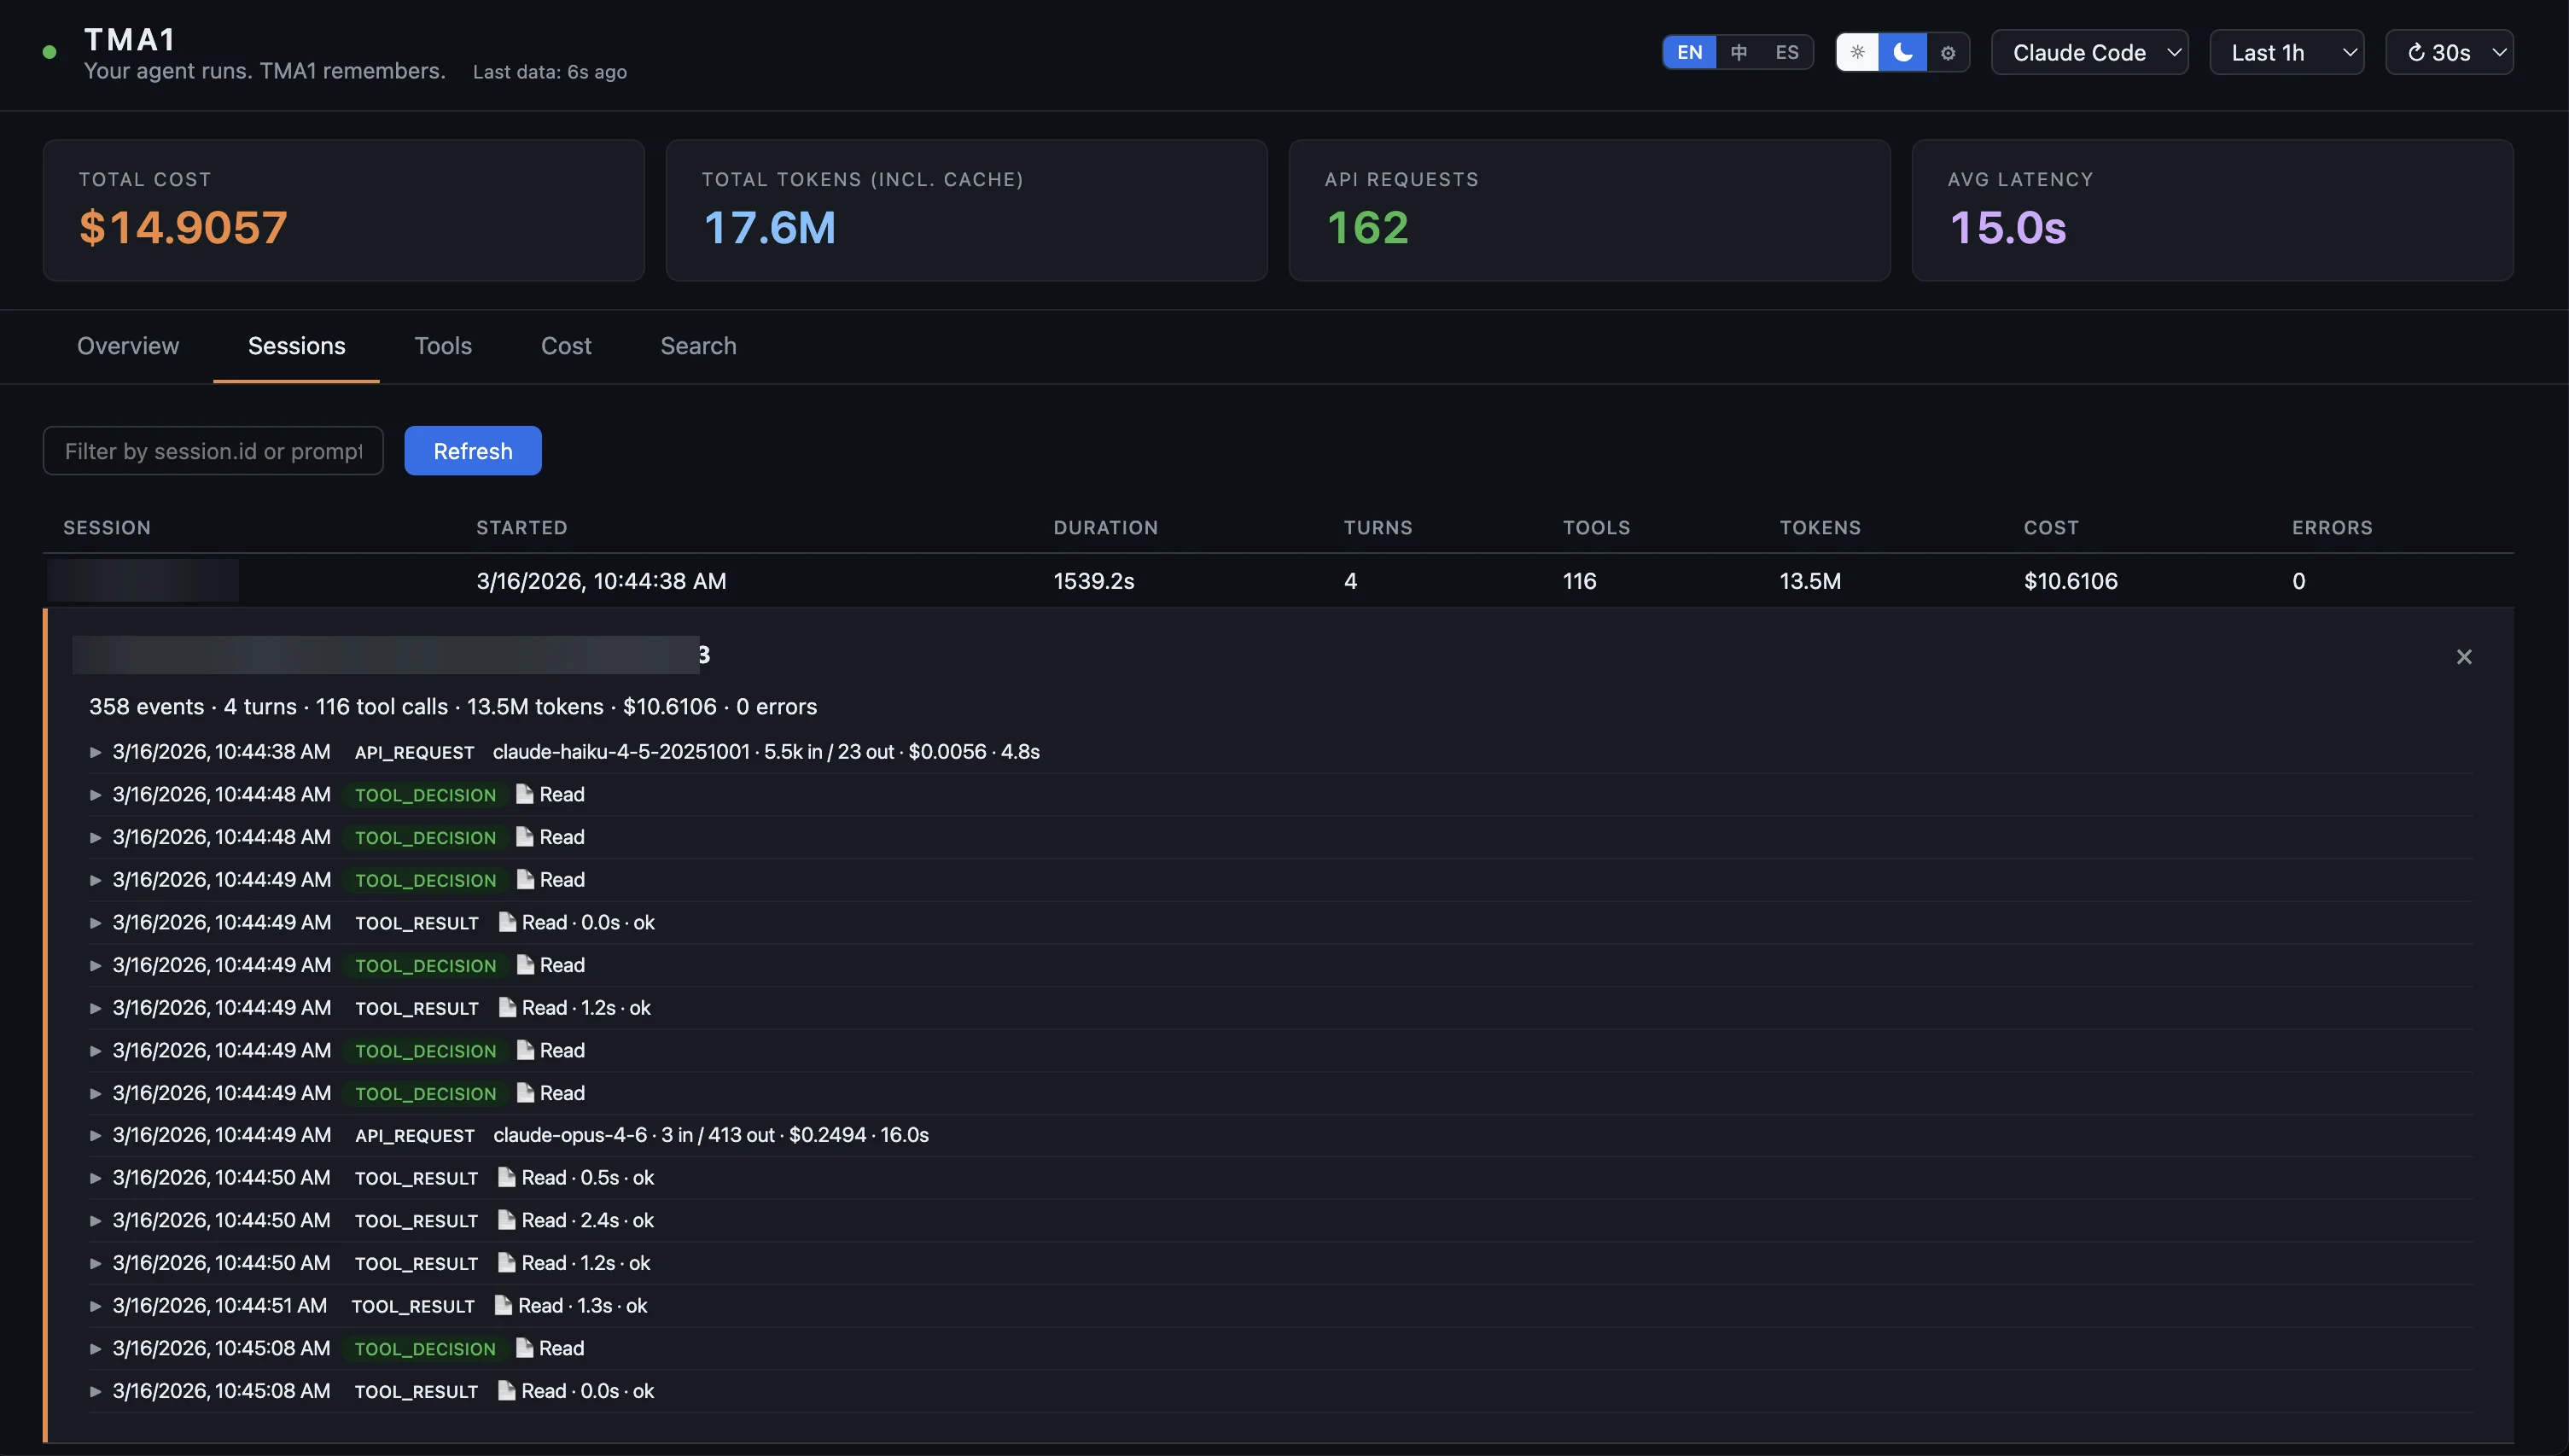
When your agent feels slow, is it the model or the tool calls? p50 and p95 latency per tool, call counts, success rates, and trend lines.
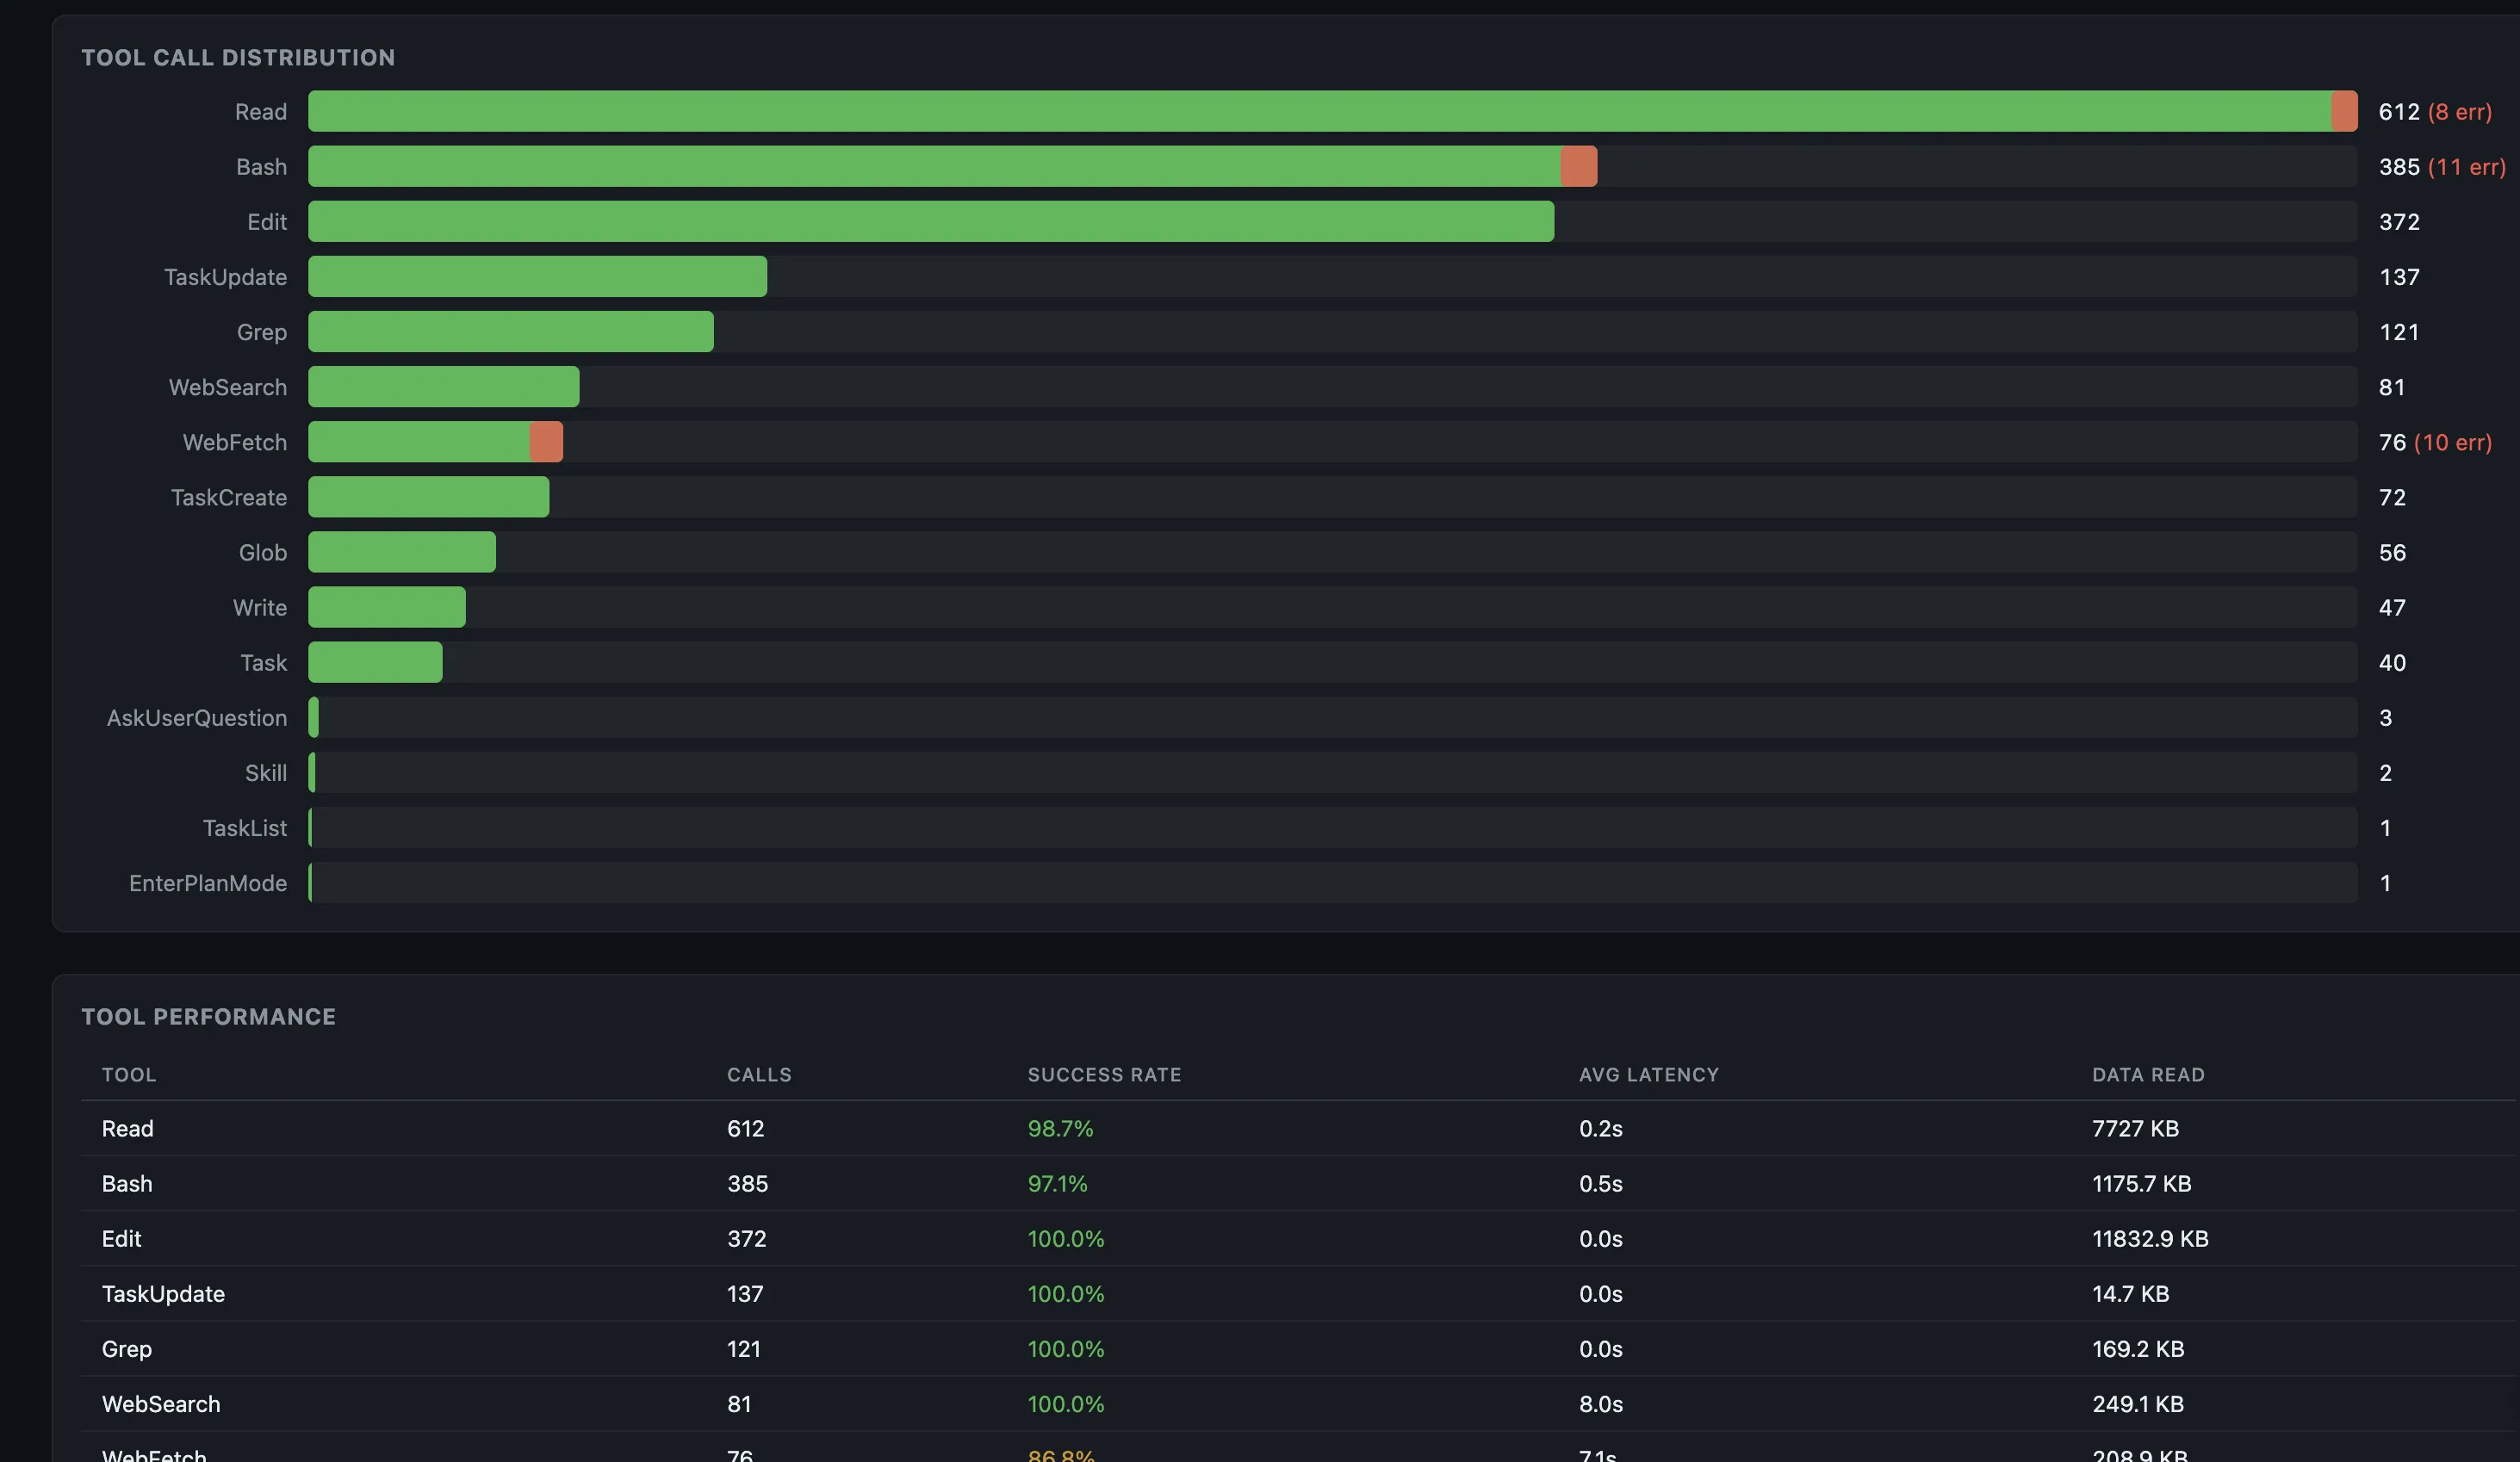
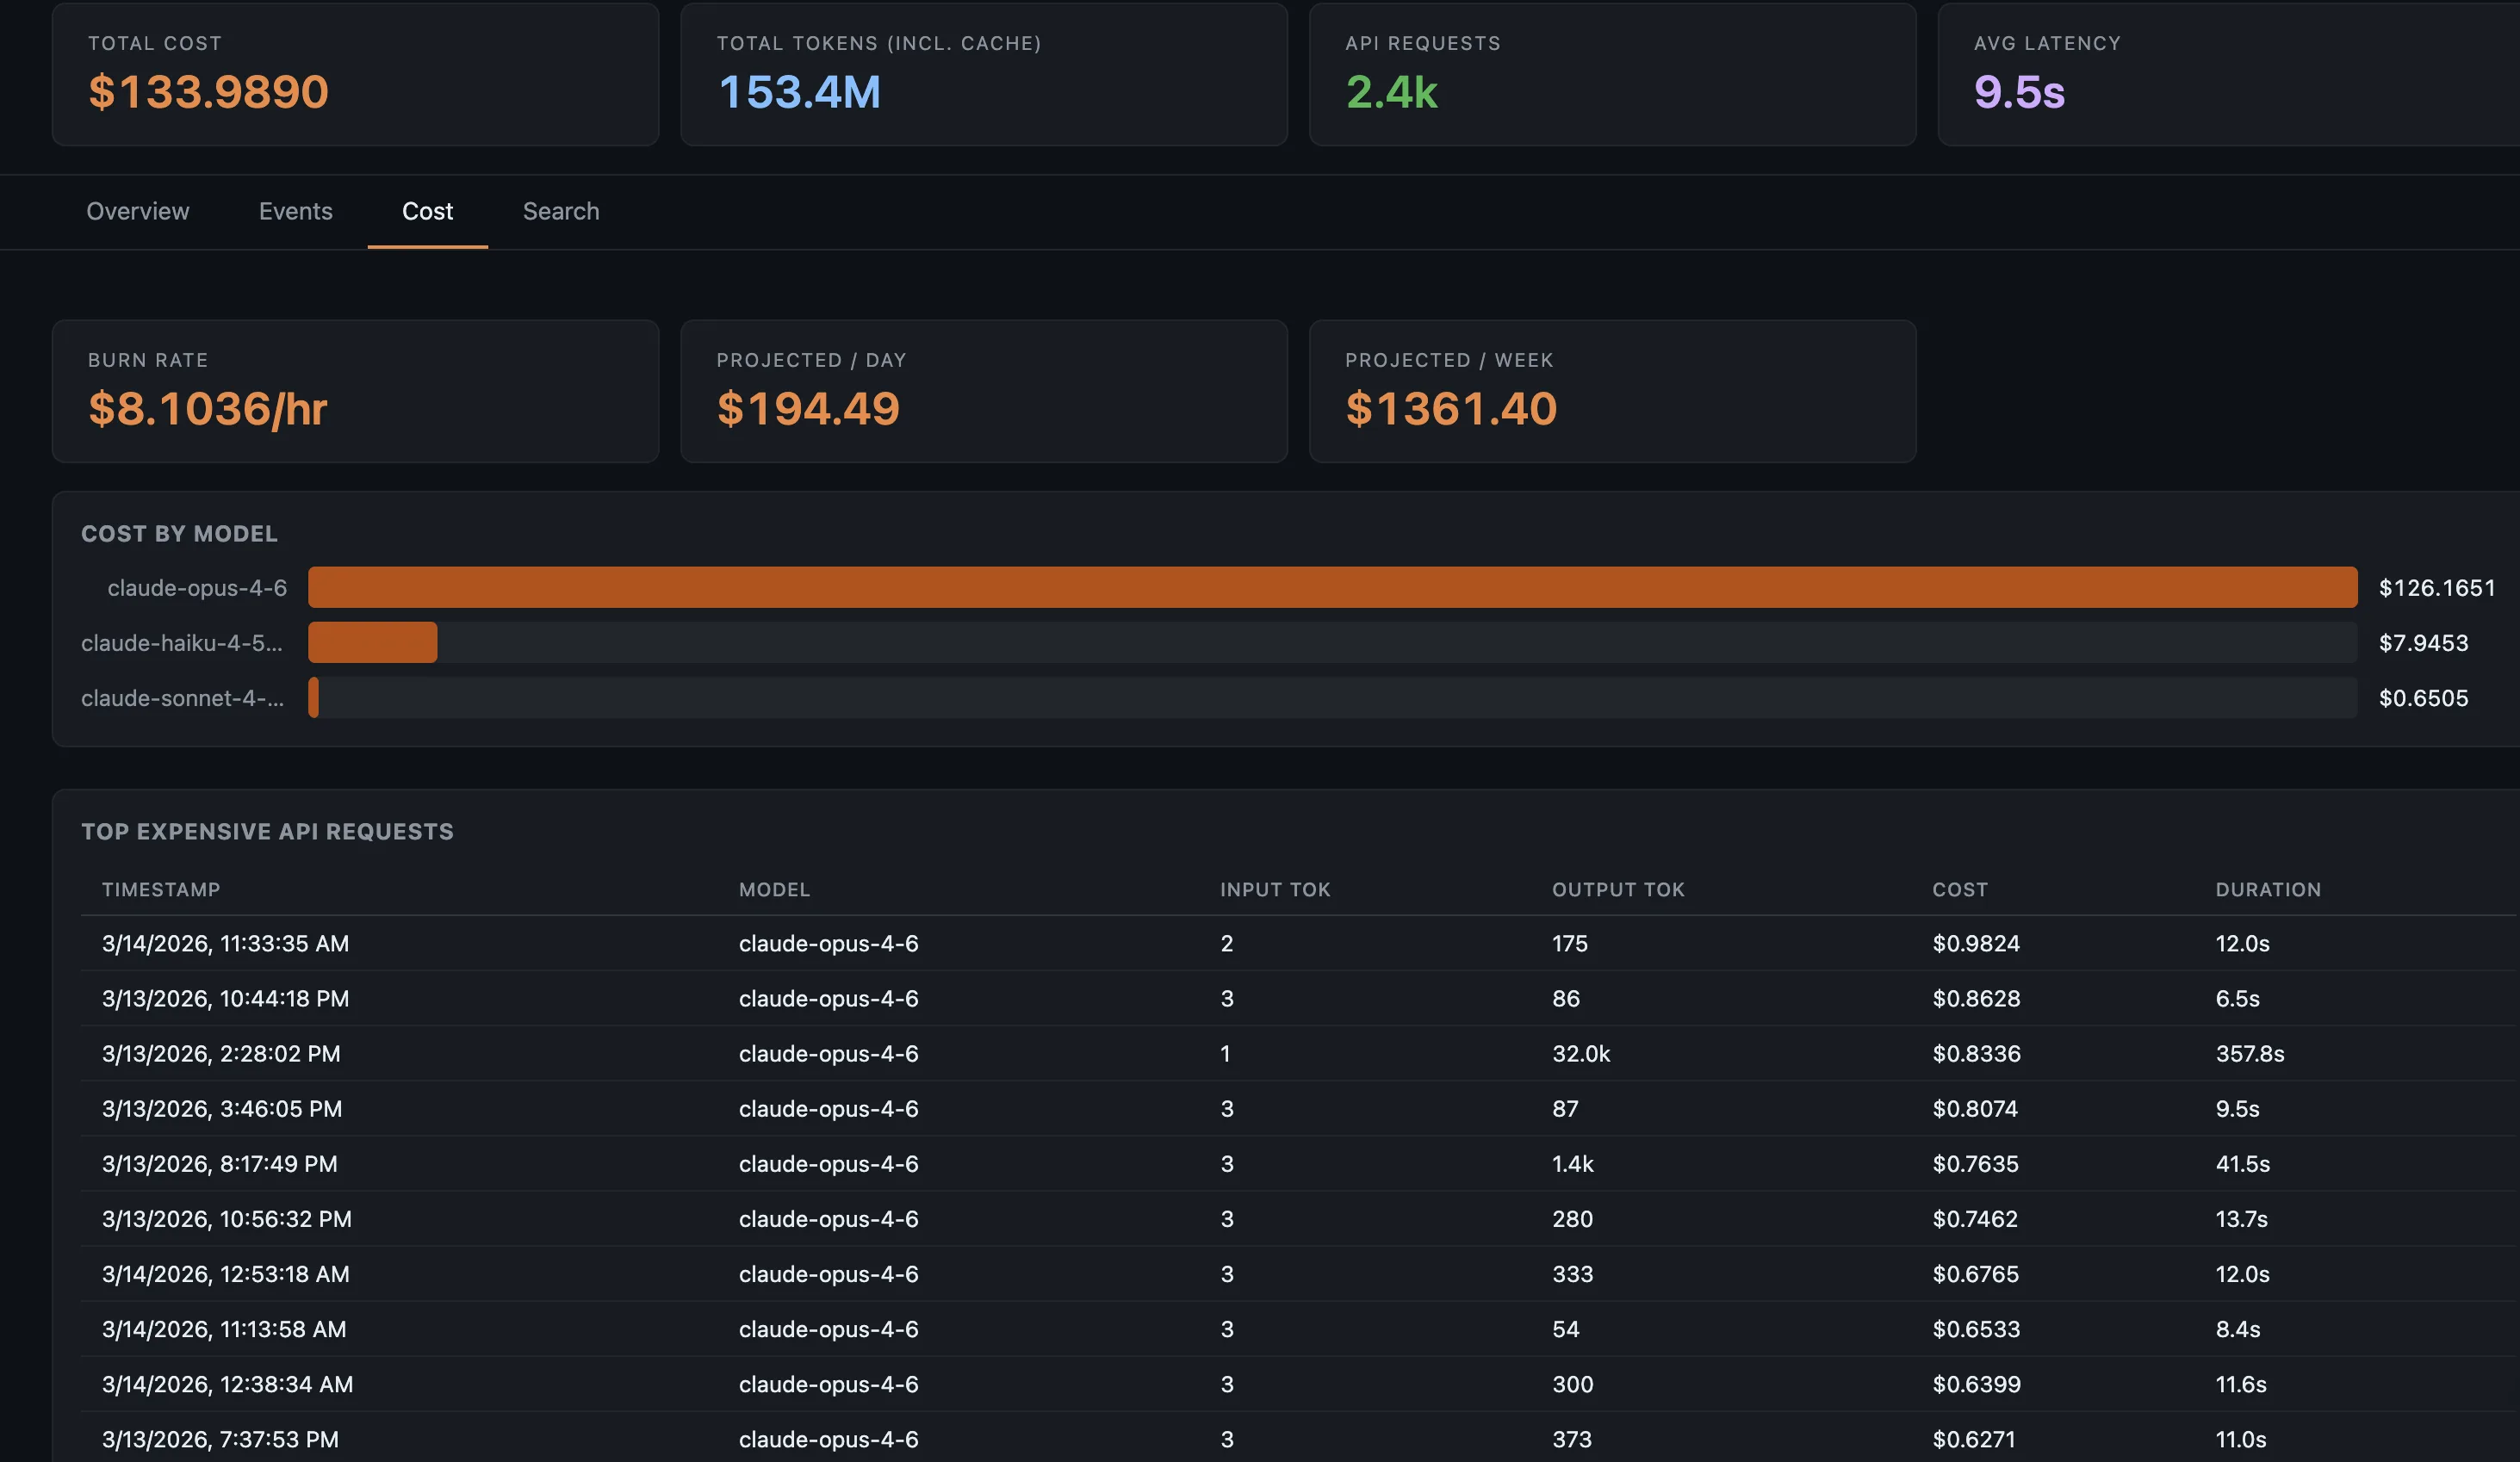
Which model costs the most? Which conversation burned through your budget? Token counts and estimated cost per model, plus burn-rate over time and cache hit ratios.
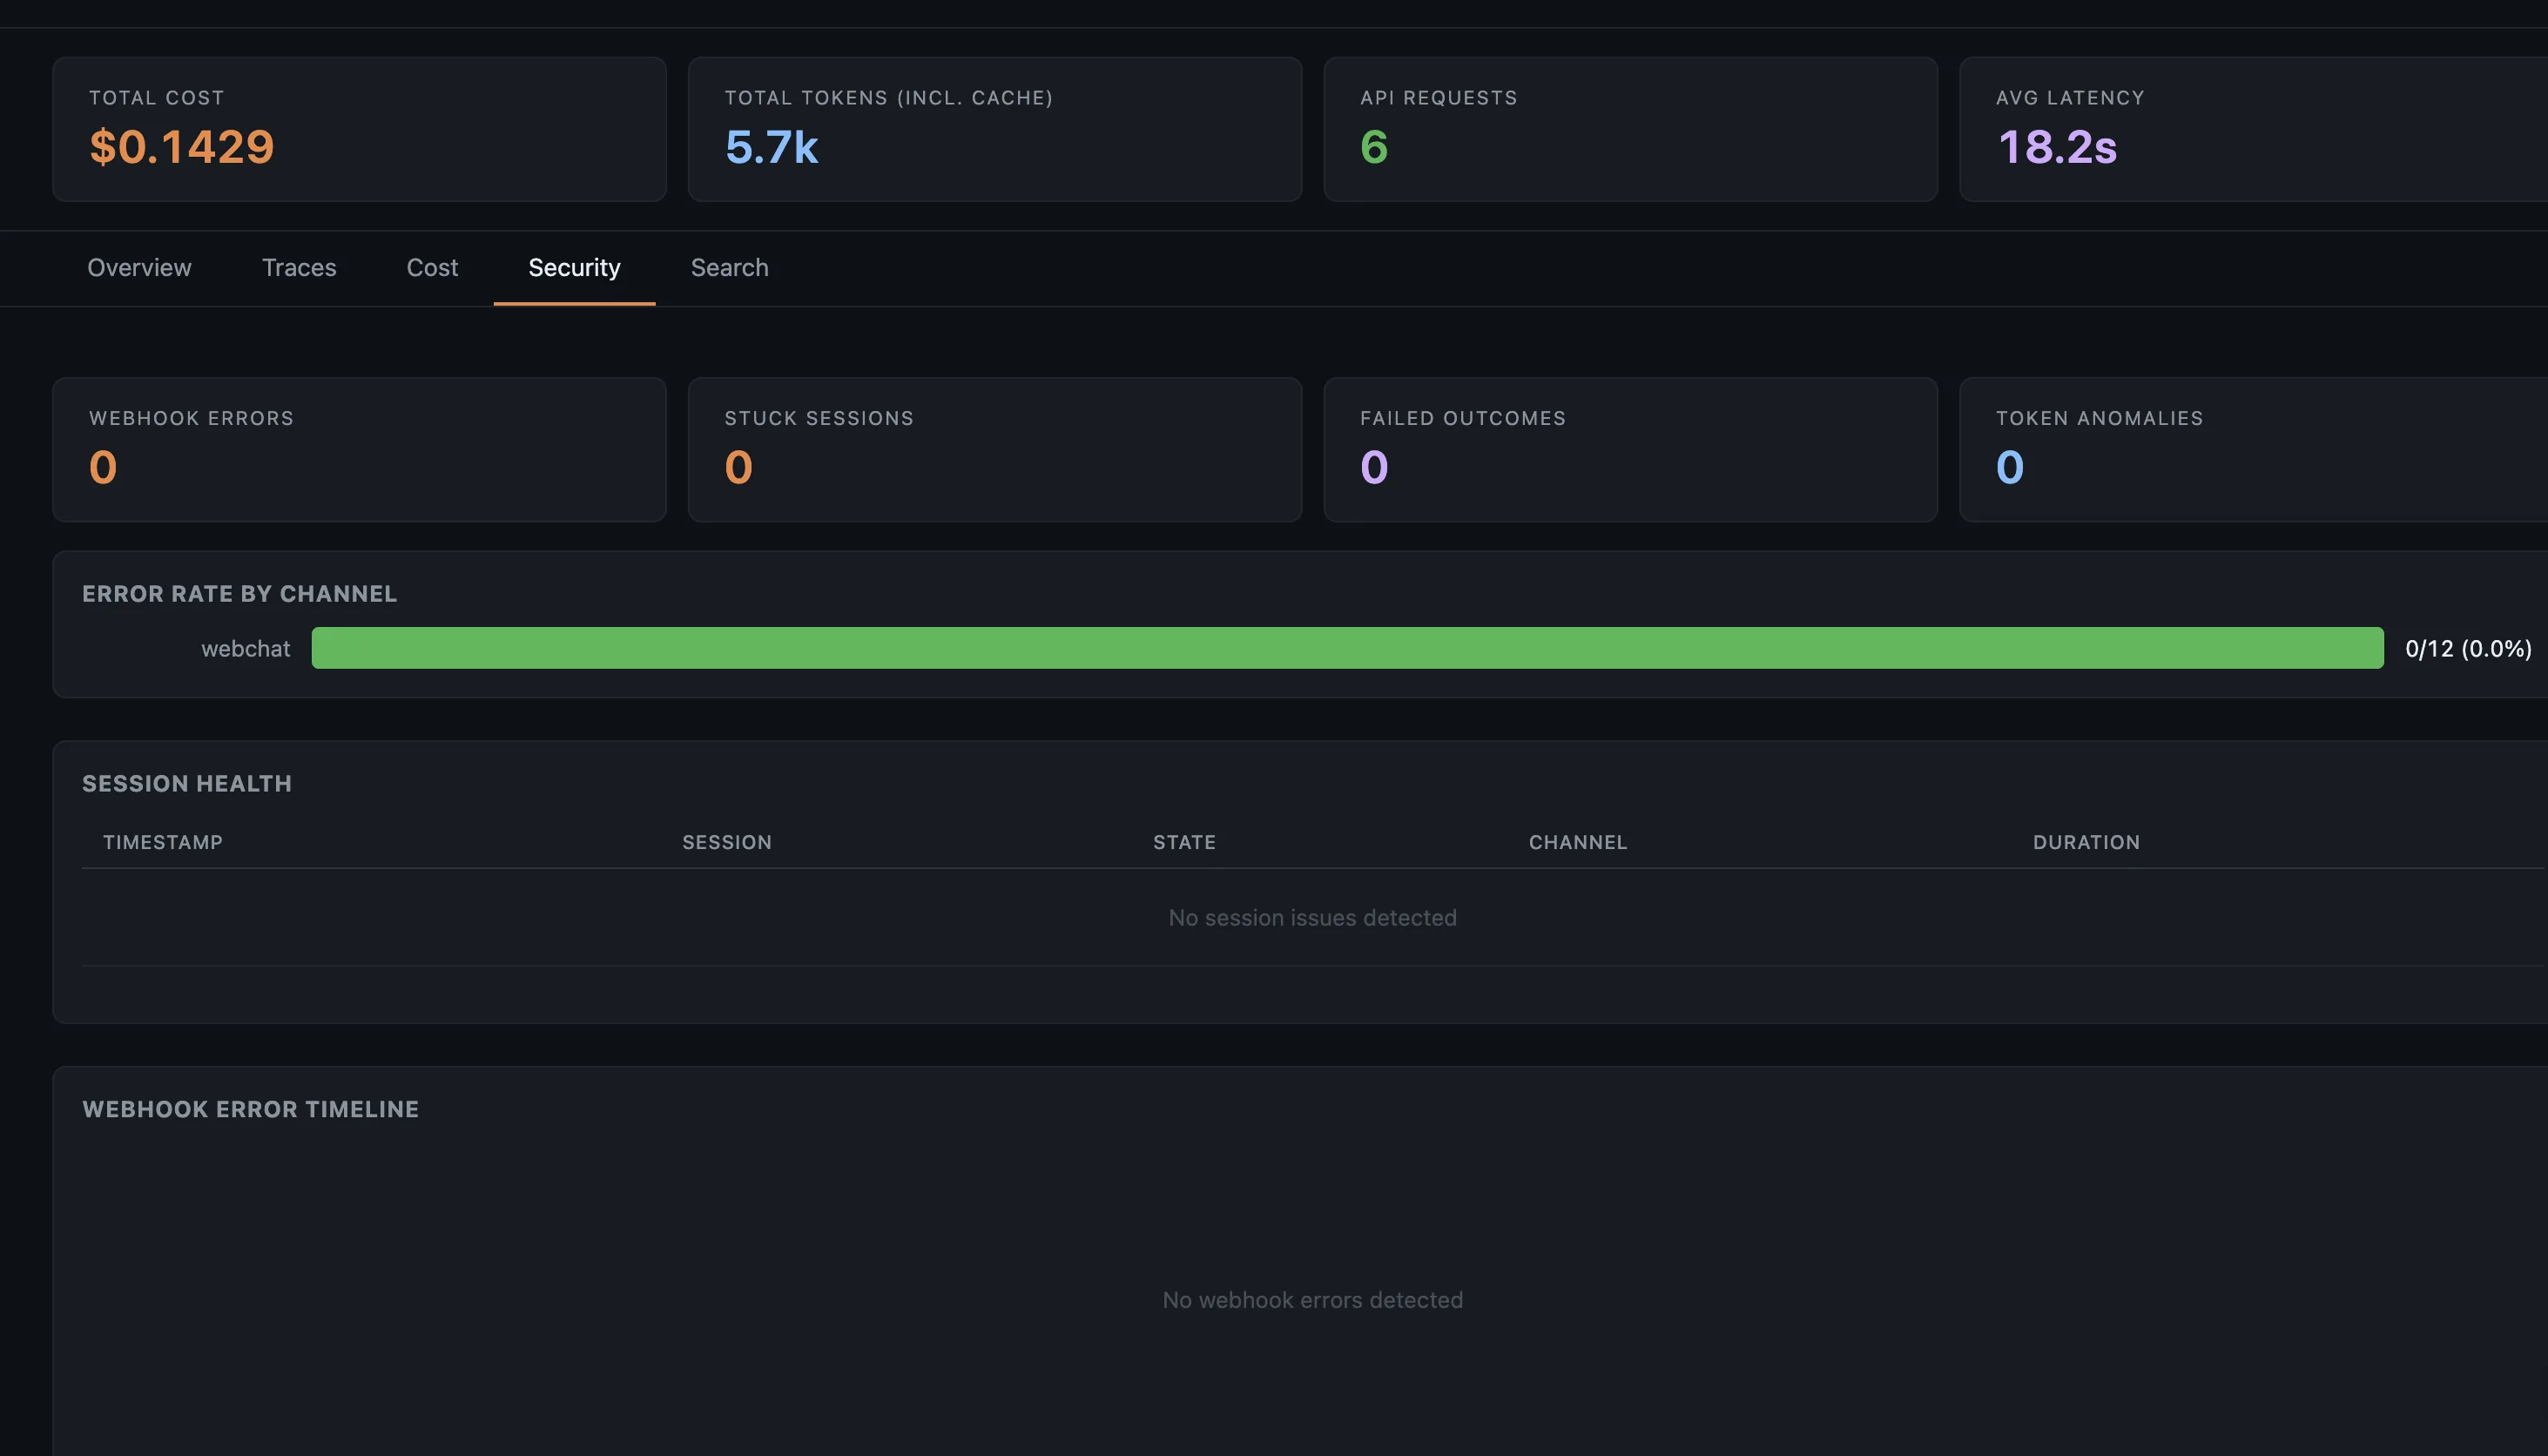
Your agent can run shell commands, fetch URLs, and be fed injected prompts. TMA1 flags all of it. For OpenClaw it also tracks webhook errors and stuck sessions.
Type a keyword in the Sessions tab to find matching conversations, tool calls, and results across every session, then click through to that exact event. The agent queries the same data through search_sessions and reads any session back with get_session_transcript.
Six weeks of sessions are on disk. The agent searches them itself, then reads the one that matters — via the /tma1-search skill.
How it works
Paste the onboarding instruction into your agent and it handles the rest, or install manually:
One command. Downloads everything into ~/.tma1/. No Docker, no system packages.
Point the OTel endpoint to http://localhost:14318/v1/otlp. Works with Claude Code, Codex, OpenClaw, or any OTel SDK. GitHub Copilot CLI needs no config — TMA1 auto-discovers its session logs.
Browse to localhost:14318 for the dashboard. The agent begins receiving <tma1-context> blocks and acting on them. Optionally wrap dev / test commands with tma1 build -- <command> so build failures feed the loop too (flags: --watch, --tag, --filter-regex). The dashboard is for the human postmortem; the loop is for the agent. For raw SQL, GreptimeDB’s own dashboard is at localhost:14000/dashboard.
Security
Your agent reads your codebase, your API keys, your infrastructure. Sending that to a cloud observability service defeats the purpose. Everything stays local.
TMA1 stores traces and conversation logs on your local disk in ~/.tma1/data/. Nothing is uploaded to remote services, and you can inspect or delete the data at any time.
After first launch (which downloads the embedded database engine once), TMA1 makes no further network calls. No analytics, no crash reports, no update checks.
TMA1 is Apache-2.0. Read the code, audit the build, and run it air-gapped.
tma1-server runs as one local process and manages its embedded storage engine. No Docker, no system packages, no runtime dependencies.
Delete ~/.tma1/ and everything is gone. No orphaned cloud state, no remote accounts to close.
FAQ
Any agent that emits OpenTelemetry data, plus a few via JSONL auto-discovery. Claude Code sends metrics and logs. Codex sends logs and metrics, and session JSONL is auto-parsed for conversation replay. GitHub Copilot CLI is zero-config: its session JSONL at ~/.copilot/session-state/ is auto-discovered. OpenClaw sends traces and metrics, and session JSONL is auto-parsed for conversation replay. Any OTel SDK app with GenAI semantic conventions works out of the box. The dashboard auto-detects the data source and shows the right view.
Yes. Run mysql -h 127.0.0.1 -P 14002 to connect to the local SQL endpoint, or open localhost:14000/dashboard/ for the built-in query UI. Your agent can query it too, through the exec_query MCP tool — one read-only SELECT per call. Traces are in opentelemetry_traces, logs in opentelemetry_logs, session data in tma1_hook_events and tma1_messages, and OTel metrics get auto-created tables.
It depends on traffic and conversation length. A typical setup uses a few hundred MB per month.