tma1-ai/

Openfuse

LLM engineering on a real observability database.

A fork of Langfuse that swaps the analytics store from ClickHouse to a time-series observability database. The Langfuse product, public APIs, and SDKs stay the same; the event store becomes the source of truth for traces, observations, scores, and the analytics behind the dashboards.

5-MINUTE QUICKSTART

OPENFUSE_STANDALONE_IMAGE=tma1ai/openfuse-standalone:1.0.0-beta.1 docker compose -f docker-compose.standalone.yml up -d --pull always

Clone the repo, cp .env.quickstart.example .env, then run this. Open localhost:3000: the quickstart env auto-creates a demo project, so you can sign in as demo@example.com / langfuse-dev, or point a Langfuse SDK at the bundled keys immediately. Those are insecure dev defaults — start from .env.prod.example for anything real, and set GREPTIME_PASSWORD to turn on enforced auth on the analytics store.

Pin a published image, or split web and worker
standalone — web + worker in one container
# pin a tag instead of building from the checkout
OPENFUSE_STANDALONE_IMAGE=tma1ai/openfuse-standalone:1.0.0-beta.1 \
docker compose -f docker-compose.standalone.yml up -d --pull always
split — scale web and worker independently
OPENFUSE_WEB_IMAGE=tma1ai/openfuse-web:1.0.0-beta.1 \
OPENFUSE_WORKER_IMAGE=tma1ai/openfuse-worker:1.0.0-beta.1 \
docker compose up -d --pull always

Your Langfuse SDKs work unchanged

Point any existing Langfuse SDK — or any OpenTelemetry tracer — at Openfuse. Traces, observations, and scores land with zero code changes.

Start small, scale as you grow

Begin with a single openfuse-standalone. The store persists to local disk or object storage, and the same engine scales out to a cluster. Scaling back down loses no data.

Cheap long retention

Object-storage-native tiered storage plus a plain SQL TTL (LANGFUSE_GREPTIME_TTL) make multi-year retention affordable. On ClickHouse-backed Langfuse, configurable retention is an Enterprise feature.

What works today

The full Langfuse UI, unchanged

Not a subset. Tracing, dashboards, datasets, evals, and exports all work, and the covered read path is checked byte-for-byte against upstream Langfuse.

[01]

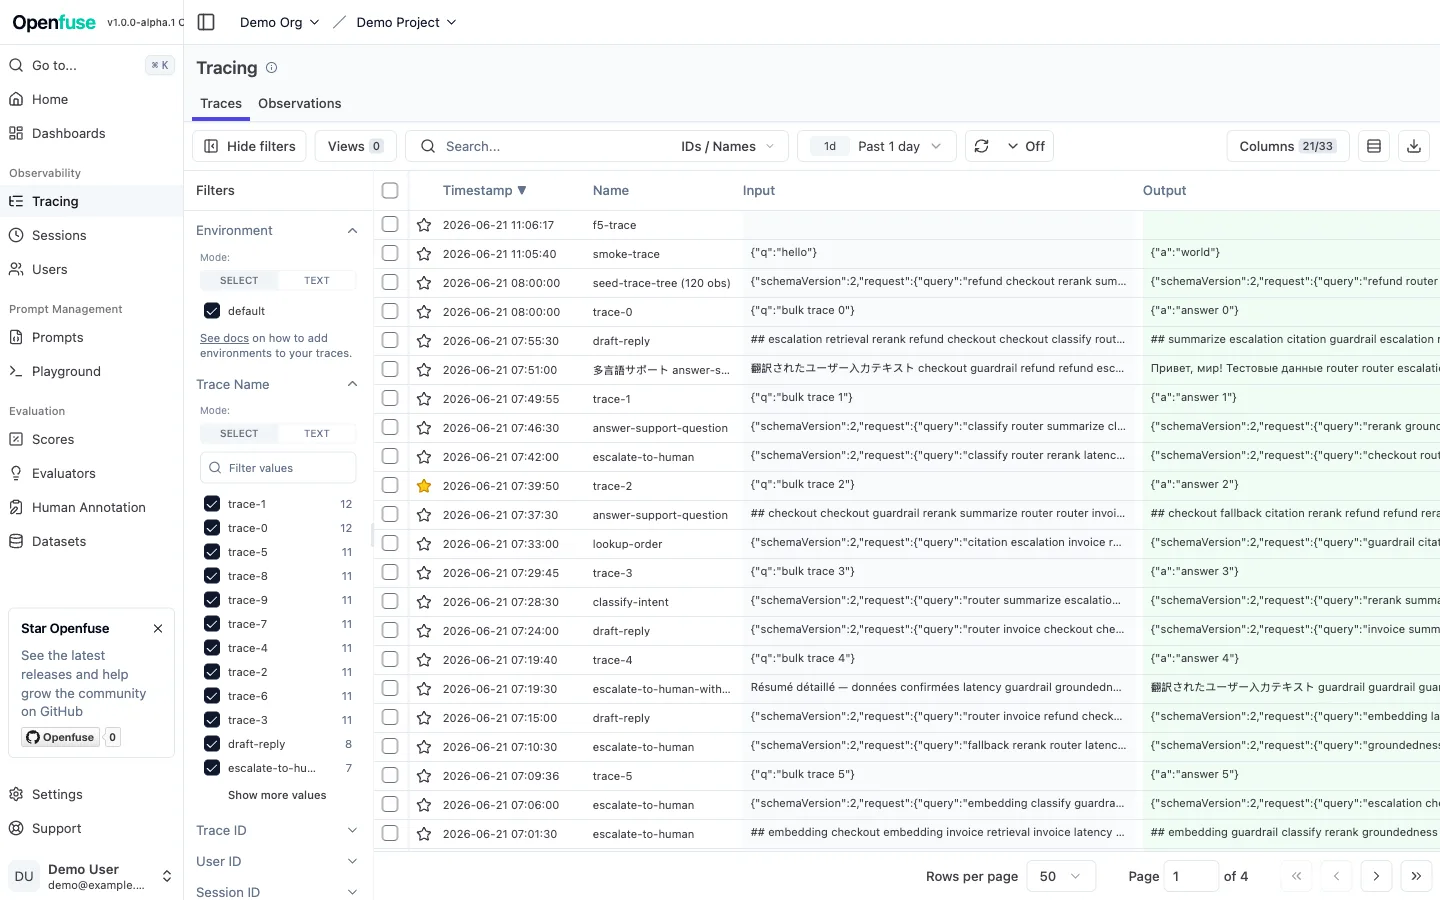
Traces and observations

Explore traces and their nested observation trees with the same search and filtering you already have. Edits, deletions, and exports behave as you would expect, including full project deletion.

localhost:3000/traces
Openfuse traces list with filters
[02]

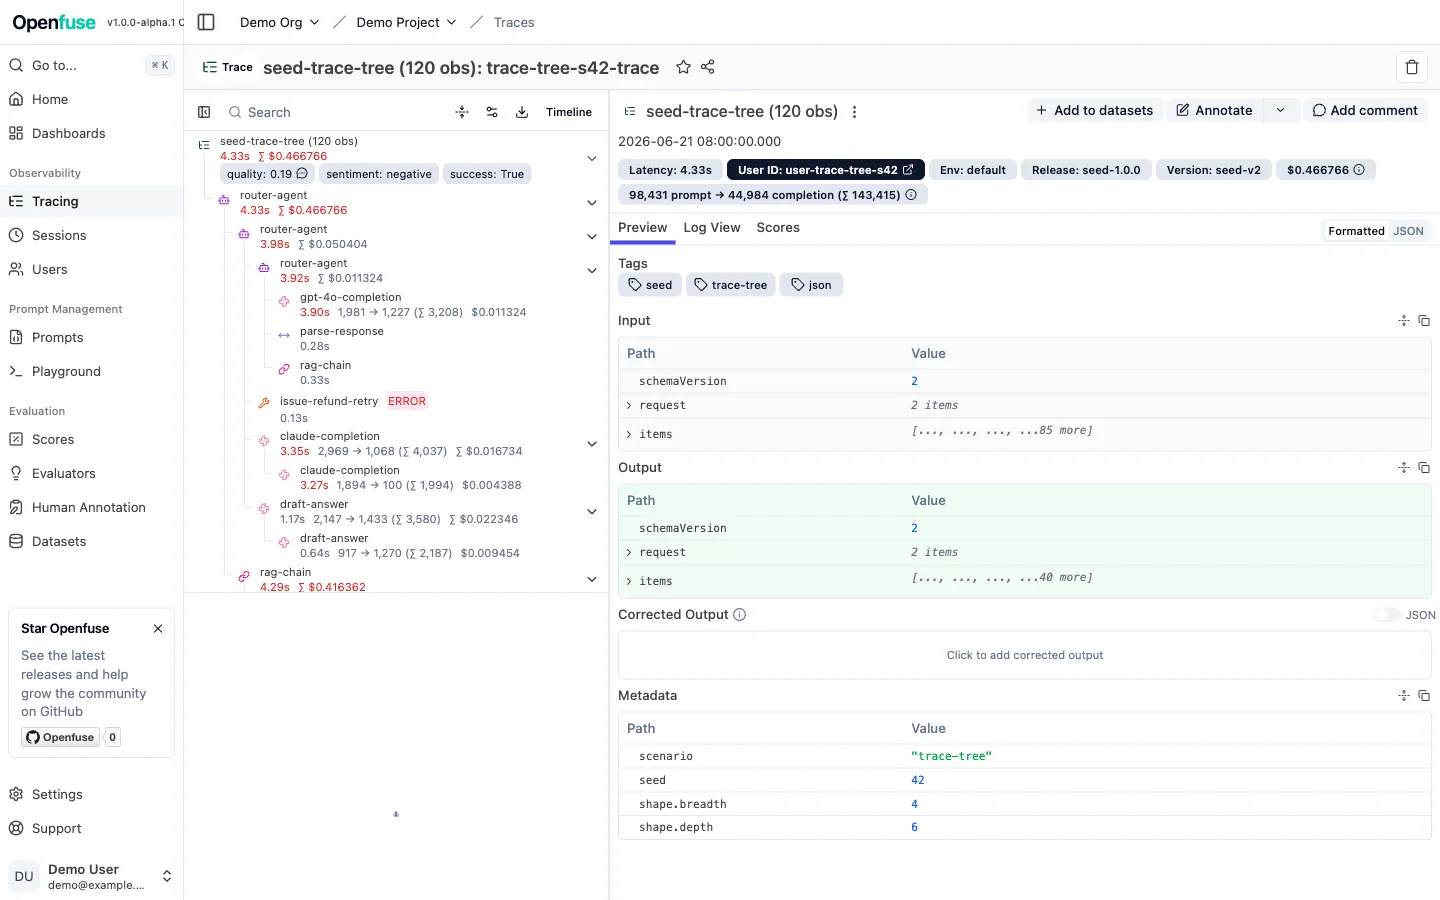
One trace, span by span

Open any trace to walk the full observation tree — inputs, outputs, model, token counts, cost, and latency at every level of nesting.

localhost:3000/traces/…
Openfuse trace detail with a nested observation tree
[03]

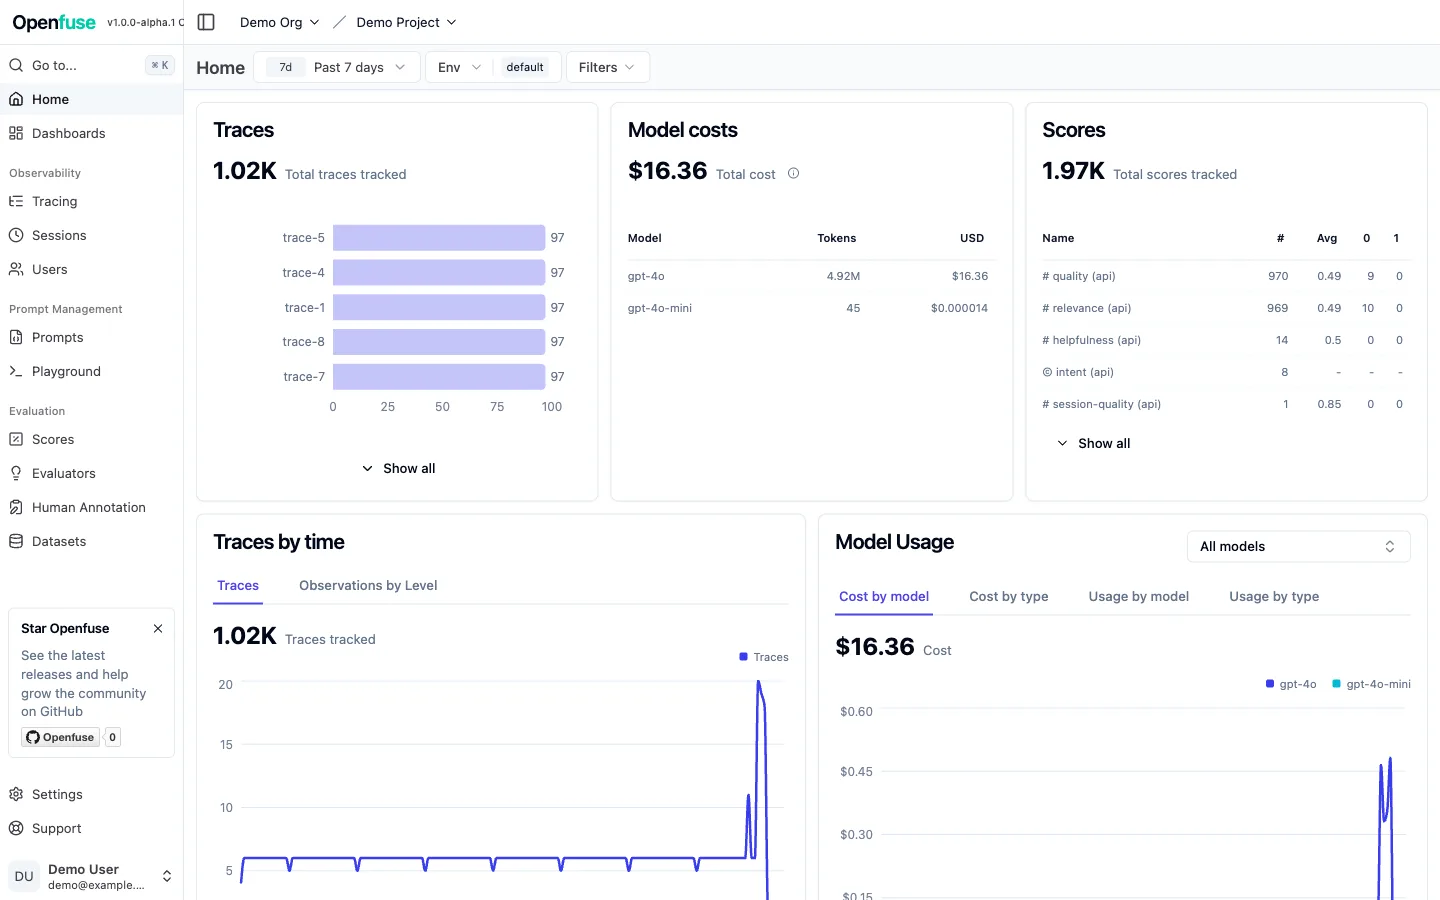
Dashboards and metrics

Cost, token usage, latency percentiles, and score analytics, broken down by metadata, tags, and tools. The intentional divergences from upstream — all cases where the fork is equal or more correct — are listed in the parity ledger.

localhost:3000
Openfuse home dashboard — traces, model cost, scores, latency
[04]

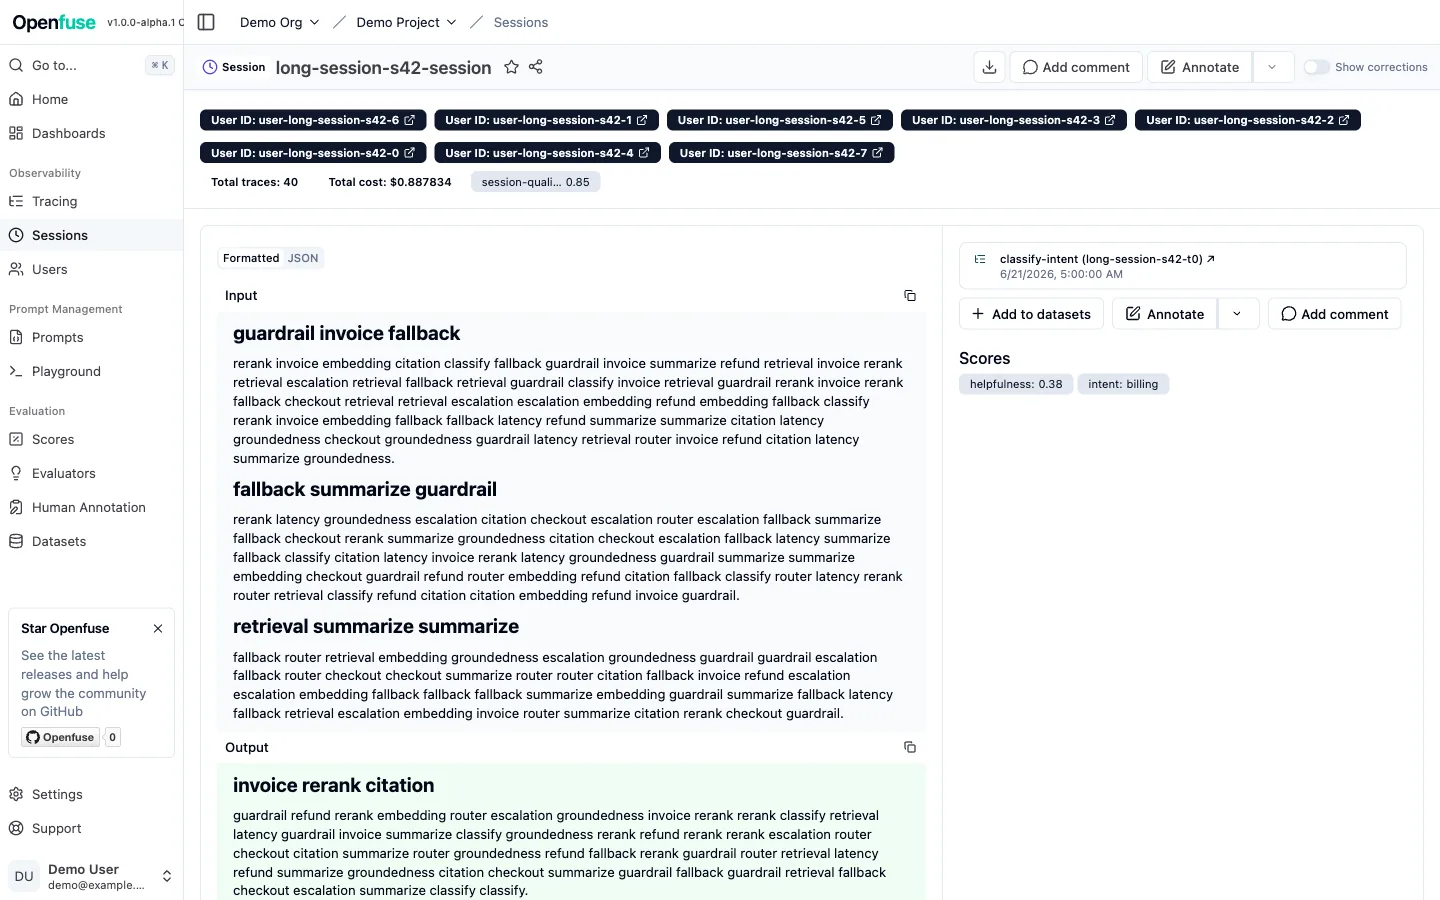
Sessions, users, and evals

Follow a multi-turn conversation end to end, or pivot to everything one user did. Datasets, experiments, and the evaluation workflow all work end to end.

localhost:3000/sessions/…
Openfuse session view

Why this store

LLM traces are observability data

Timestamped wide events with high-cardinality context. That is what a unified observability database is built for.

Where the data lives

Metrics, logs, and traces live in one engine: SQL and PromQL/TQL queryable, OTLP-native, with compute–storage separation over object storage. Postgres still holds application and config data — users, projects, prompts, dataset definitions, API keys — unchanged from upstream Langfuse. The analytics event store is an append-only raw_events table as the source of truth, plus merged projection tables and indexed EAV side-tables that back metadata, tag, and tool filtering. Redis runs the BullMQ queues.

No bucket required

Media uploads, the OTel carrier, the eval blob store, and batch exports all default to local filesystem paths. A stock deployment needs no S3 or MinIO — turn object storage on when you want tiered storage, not to get started.

Directional, not delivered

Because the events already live in a real observability database, PromQL-native metrics, logs ↔ traces correlation, OTLP-native ingestion, and Flow continuous aggregation become reachable. Those are tracked as ideas in issue #8 — not features you can use today.

Project status

Beta

Try it, run real workloads against it, and open issues. That feedback is what gets it to a stable release.

What is done

The ClickHouse → GreptimeDB migration is in place, the read path is parity-checked byte-for-byte against upstream, and the full Langfuse product, API, and SDK surface works.

Known limitations

Known limitations is a short list of real constraints, plus the few intentional differences from upstream. Skim it before you depend on this.

A community fork

Openfuse is not affiliated with or endorsed by Langfuse. It retains upstream copyright and attribution.

MIT

Every feature ships unlocked. No enterprise tier, no commercial license key, no feature gated behind a contract.

FAQ

Common questions

Do I have to change any code?

No. Openfuse 1.0.0-beta.1 is based on upstream Langfuse v3.184.1, and existing Langfuse SDKs plus the public ingestion and REST APIs work unchanged. Any OpenTelemetry tracer works too.

How do schema migrations work?

Postgres migrations are upstream Langfuse’s and apply as-is. The GreptimeDB schema is fork-specific and migrates automatically on container startup — idempotent, advisory-lock serialised, and fail-closed.

What exactly differs from upstream Langfuse?

Dashboard and metrics output is checked byte-for-byte against upstream for the covered query surface. The handful of intentional divergences, all cases where the fork is equal or more correct, are in the parity ledger. Migration from Langfuse has the full compatibility statement.